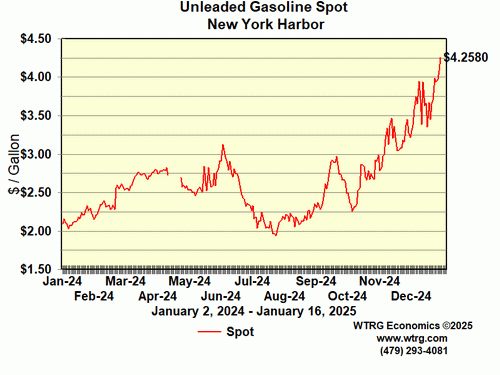
graphs of Gasoline & ULSD
#1
http://www.wtrg.com/daily/oilandgasspot.html#Gasoline

the "Heating Oil' graph below it
is generally considered a substitute for diesel fuel,
but it runs several percent below ULSD prices
as you can compare to official gov numbers here:
http://tonto.eia.doe.gov/dnav/pet/hi...e_nus_cpgw.htm


the "Heating Oil' graph below it
is generally considered a substitute for diesel fuel,
but it runs several percent below ULSD prices
as you can compare to official gov numbers here:
http://tonto.eia.doe.gov/dnav/pet/hi...e_nus_cpgw.htm

#3
it has been a very expensive experiment
but we now know that:
small changes in consumption (3% to 7%)
lead to huge changes in price (as much as 100%)
.... and it can be worse if
large speculators have access to huge bank loans
so that they can use leverage as high as 30 to 1
in the oil futures contracts markets
but we now know that:
small changes in consumption (3% to 7%)
lead to huge changes in price (as much as 100%)
.... and it can be worse if
large speculators have access to huge bank loans
so that they can use leverage as high as 30 to 1
in the oil futures contracts markets

